


COLORADO (KOAA) — As Colorado’s snowpack continues to decline, drought conditions are becoming more widespread across the state.
This weekend, I ran into a viewer who asked if there was an actual definition for drought. It is a good question because a lot of science goes into the drought maps we show.
WHAT IS A DROUGHT?
Drought is not just a way to measure rain and snow. To figure out where drought is and how severe it is, scientists from the National Oceanic and Atmospheric Administration and the U.S. Department of Agriculture look at a blend of data. In short - there is NOT a single definition to tell you "if you're a certain percentage short of rainfall over six months...that's a minor drought".
WHAT ARE THE TYPES OF DROUGHT?
There are multiple types of drought.
Agricultural drought looks at how a lack of moisture impacts the ability of farmers to grow crops.
Hydrological drought is based on how a lack of rainfall or snowpack impacts river flow or reservoir levels.
Meteorological drought is directly tied to a lack of precipitation compared to the average for an area.
Ecological drought involves a longer-duration deficit in available water supplies that stresses the environment.
Finally, Socio-economic drought measures things like energy production deficits due to a lack of water.
Some types of drought, like meteorological, can develop quickly. Others, like hydrologic drought caused by a lack of snowpack, develop slowly and take longer to improve.
The U.S. Drought Monitor map is a combination of all of these types of drought, and short and long-term weather patterns. Recognizing when a drought starts and ends requires understanding what is normal for a given location over time. If an area has been in a drought for a long time, it can take more than one or two rainstorms to end it, and heat can dry things out quickly too.
Scientists evaluate multiple timescales, from weekly to multiple years. They look at streamflow, reservoir levels, and evaporation demand, which measures how thirsty the atmosphere is and how easily water leaves soil and plants.
SO WHO DEFINES WHAT A DROUGHT IS THEN?
This part may surprise you. The drought map is ultimately made by people; it's not defined by a specific number or automatic formula.
The lead author starts with the prior week's map and reviews all drought indicators. Sometimes one indicator shows improvement while another shows worsening conditions, so experts must determine which impact is more relevant.
The Drought Monitor provides a recent snapshot of conditions, not a forecast. It is released on Thursdays after a data collection period running from Wednesday to Tuesday. Authors then have two days to review the most recent data. In practice, the map will not move a location by more than one intensification category per week, though the USDA notes things can move faster in the event of a major storm.
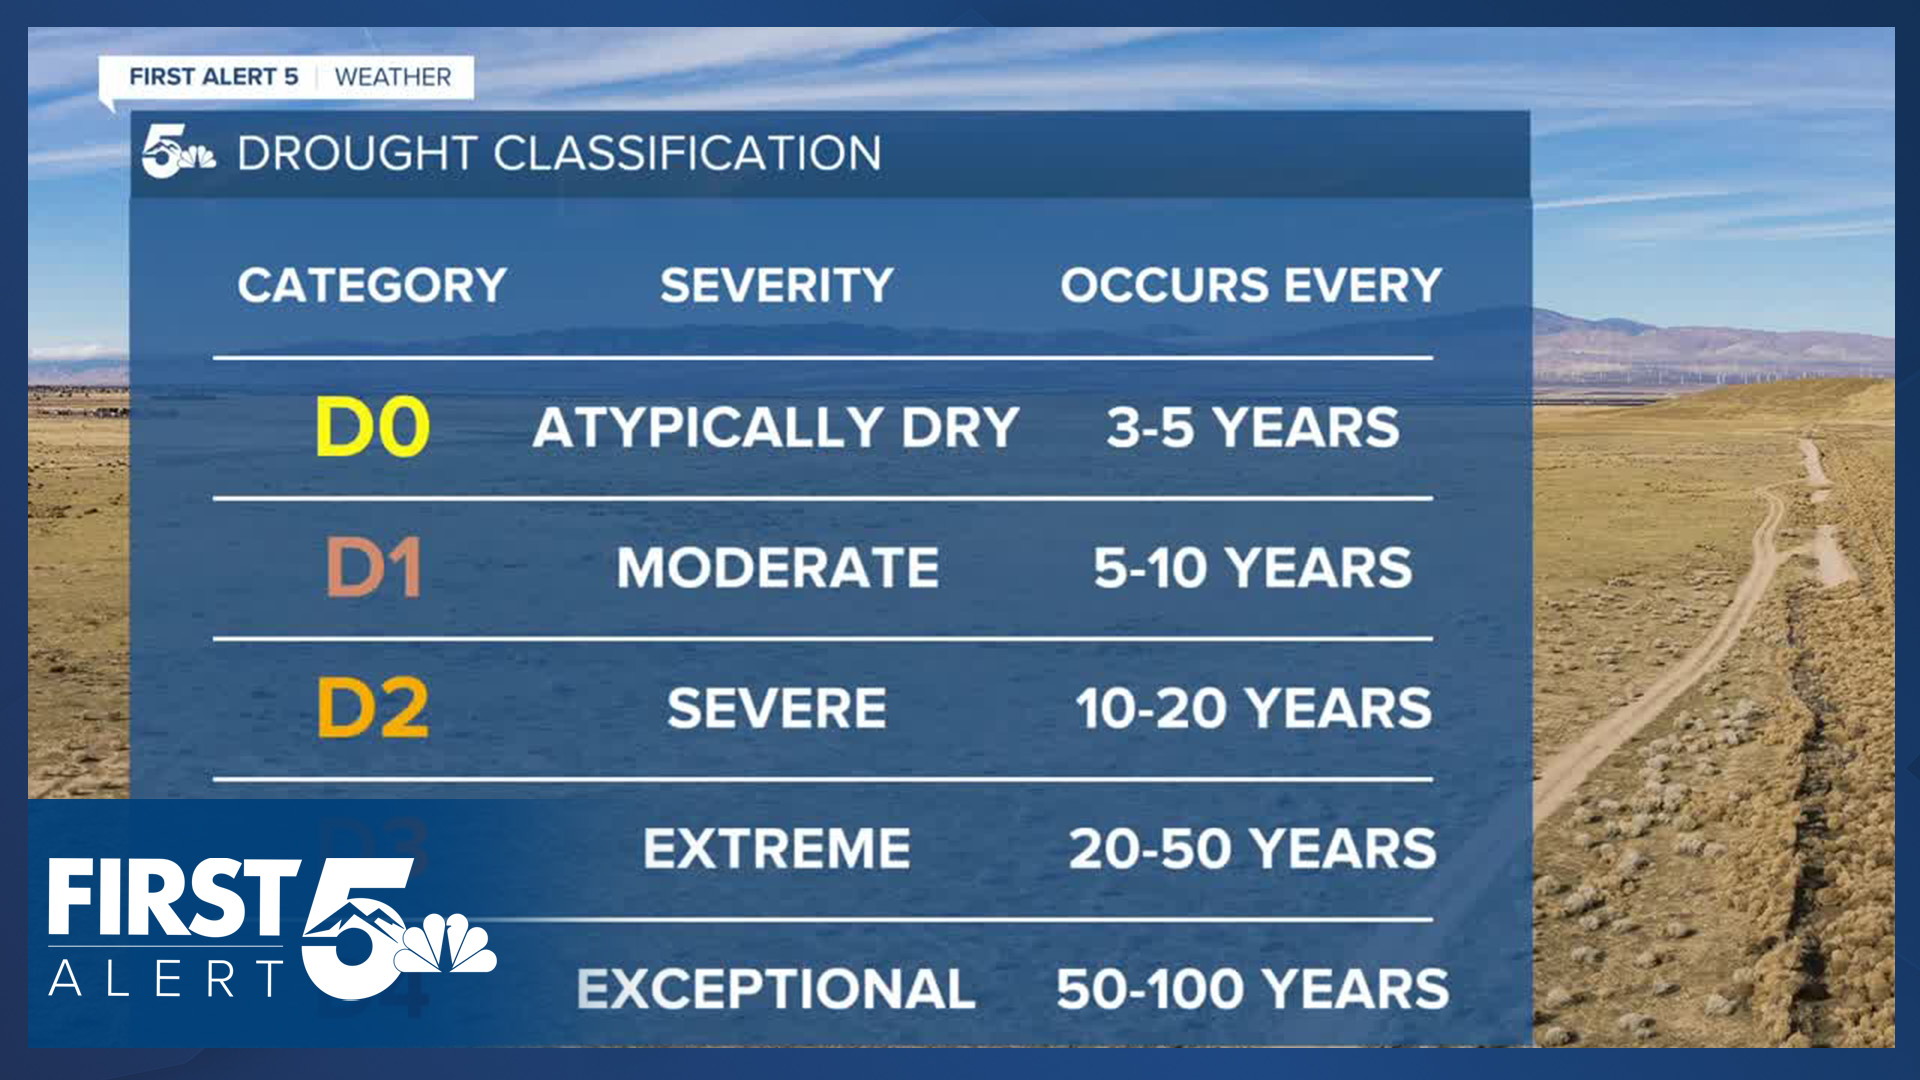
HOW DOES THE SCALE WORK?
Conditions are defined on a scale ranging from D0, meaning abnormally dry, to D4, meaning exceptional drought. While there is no set rule, D0 indicators are generally between the 20th and 30th percentile. D1 indicators are in the 10th to 20th percentile, D2 between the fifth and 10th percentile, D3 between the second and fifth percentile, and D4 between the zero and second percentile. In other words, when looking at things like reservoir levels, streamflow, snowpack, precipitation deficits, evaporation demand and more - those percentiles come into play for the person who is building the drought map. They also speak to local experts.
WHAT'S THE CURRENT DROUGHT SITUATION IN COLORADO?
Looking at the current drought map, which measured conditions between March 18 and March 24, only nine percent of Colorado's land is drought-free. About 75 percent of the state is in at least a minor drought. But, a significant portion of southern Colorado comprises that 9% - including Colorado Springs, Pueblo, and portions of eastern Teller County near Woodland Park.
That's because southern Colorado is often dry in the winter months. Much of the winter precipitation in the state falls in the mountains. So, even if overall precipitation amounts aren't impressive - it's difficult for southern Colorado to develop drought during the winter season.
This week's map was produced by Rocky Bilotta at the National Centers for Environmental Information.
This story was reported on-air by a journalist and has been converted to this platform with the assistance of AI. Our editorial team verifies all reporting on all platforms for fairness and accuracy.
____
Have a question or story idea you would like the First Alert 5 Weather team to consider? Email: weather@koaa.com
Watch KOAA News5 on your time, anytime with our free streaming app available for your Roku, FireTV, AppleTV and Android TV. Just search KOAA News5, download and start watching.
