With all the Red Flag Warnings over the past couple weeks (35 issued since January 1st), drought and wild fires seem to be on everyone’s minds. With the help of the National Weather Service branch in Pueblo, Colorado Springs Utilities, and the Bureau of Reclamation we can piece together how bad the drought really is over southern Colorado.
Starting with the basics: What is the current state of the drought monitor and snowpack?
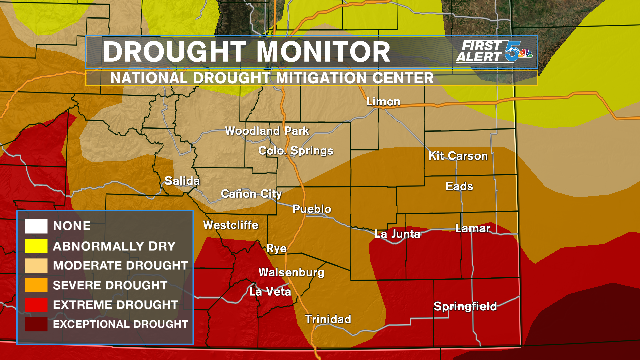
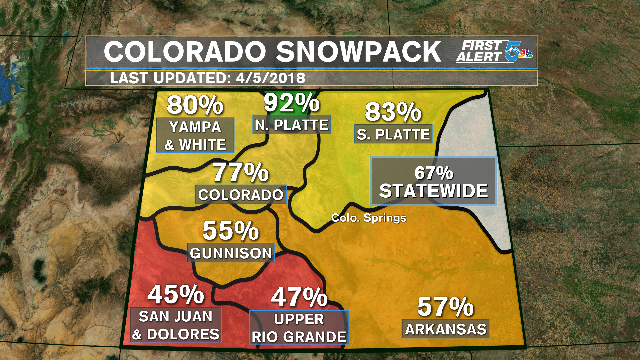
To be short and sweet… both the drought monitor and snowpack aren’t in great shape. The drought monitor shows at least 90% of the state is suffering from at least some form of drought ranging from abnormally dry to extreme drought. The snowpack, thanks to a few decent March snows, is below normal, but just under one quarter below normal.
What does the water supply look like?
Surprisingly, the water supply is pretty great! Colorado Springs Utilities is reporting that the Pikes Peak reservoir is at 68% capacity, the Rampart reservoir is at 75%, and the system total is at 81% capacity. 80% capacity is generally considered full capacity as they always leave room at the top for overflow or unexpected heavy rain/snow. Colorado Springs Utilities is also reporting they have more than 3 years of water demand in storage. The Pueblo reservoir is also showing great results with a current capacity right near 80%. This is high enough that the Pueblo reservoir is going to release over half a million gallons on April 15th to compensate for upcoming mountain snow melt.
How can the reservoir levels be in such great shape with the lack rain and snow over the last several months?
One big thing to remember that we’ve already forgotten about is how well southern Colorado did with precipitation last Spring and Summer. Below are two charts that show the amount of precipitation observed compared to average from the start of the water year in October, as well as what we’ve seen over the year since last April.
(Observed vs Average Precipitation since the start of the water year on Oct 1st, 2017)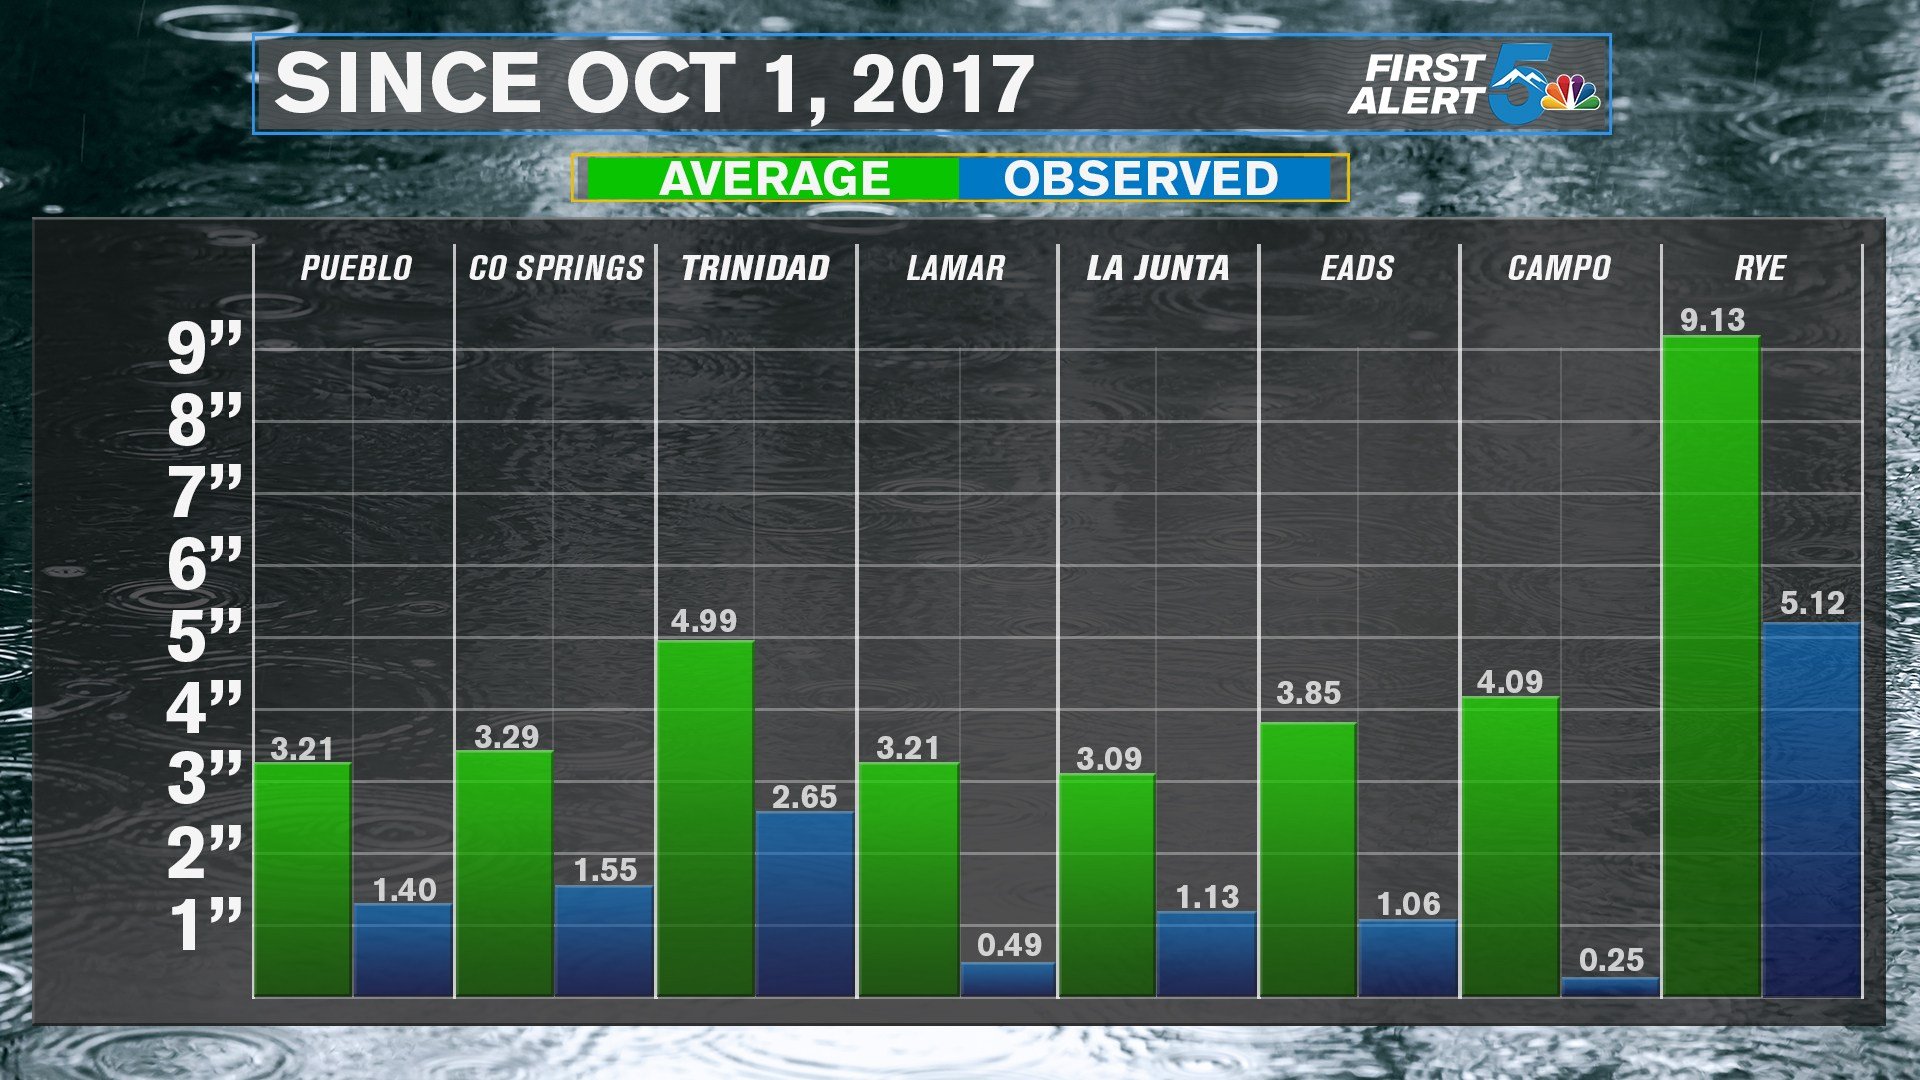
This graph displays the observed precipitation (rain and the water equivalent of snow) from the start of the water year in October till now. The graph clearly shows we have not done well from Fall through Winter. The observed precipitation in this time frame is roughly 50% of what the average recorded precipitation should be during the same time frame. Let’s look at how the average and observed levels compare to each other, but this time we’ll include what we saw last Spring and Summer.
(Observed vs Average Precipitation since last April, 2017)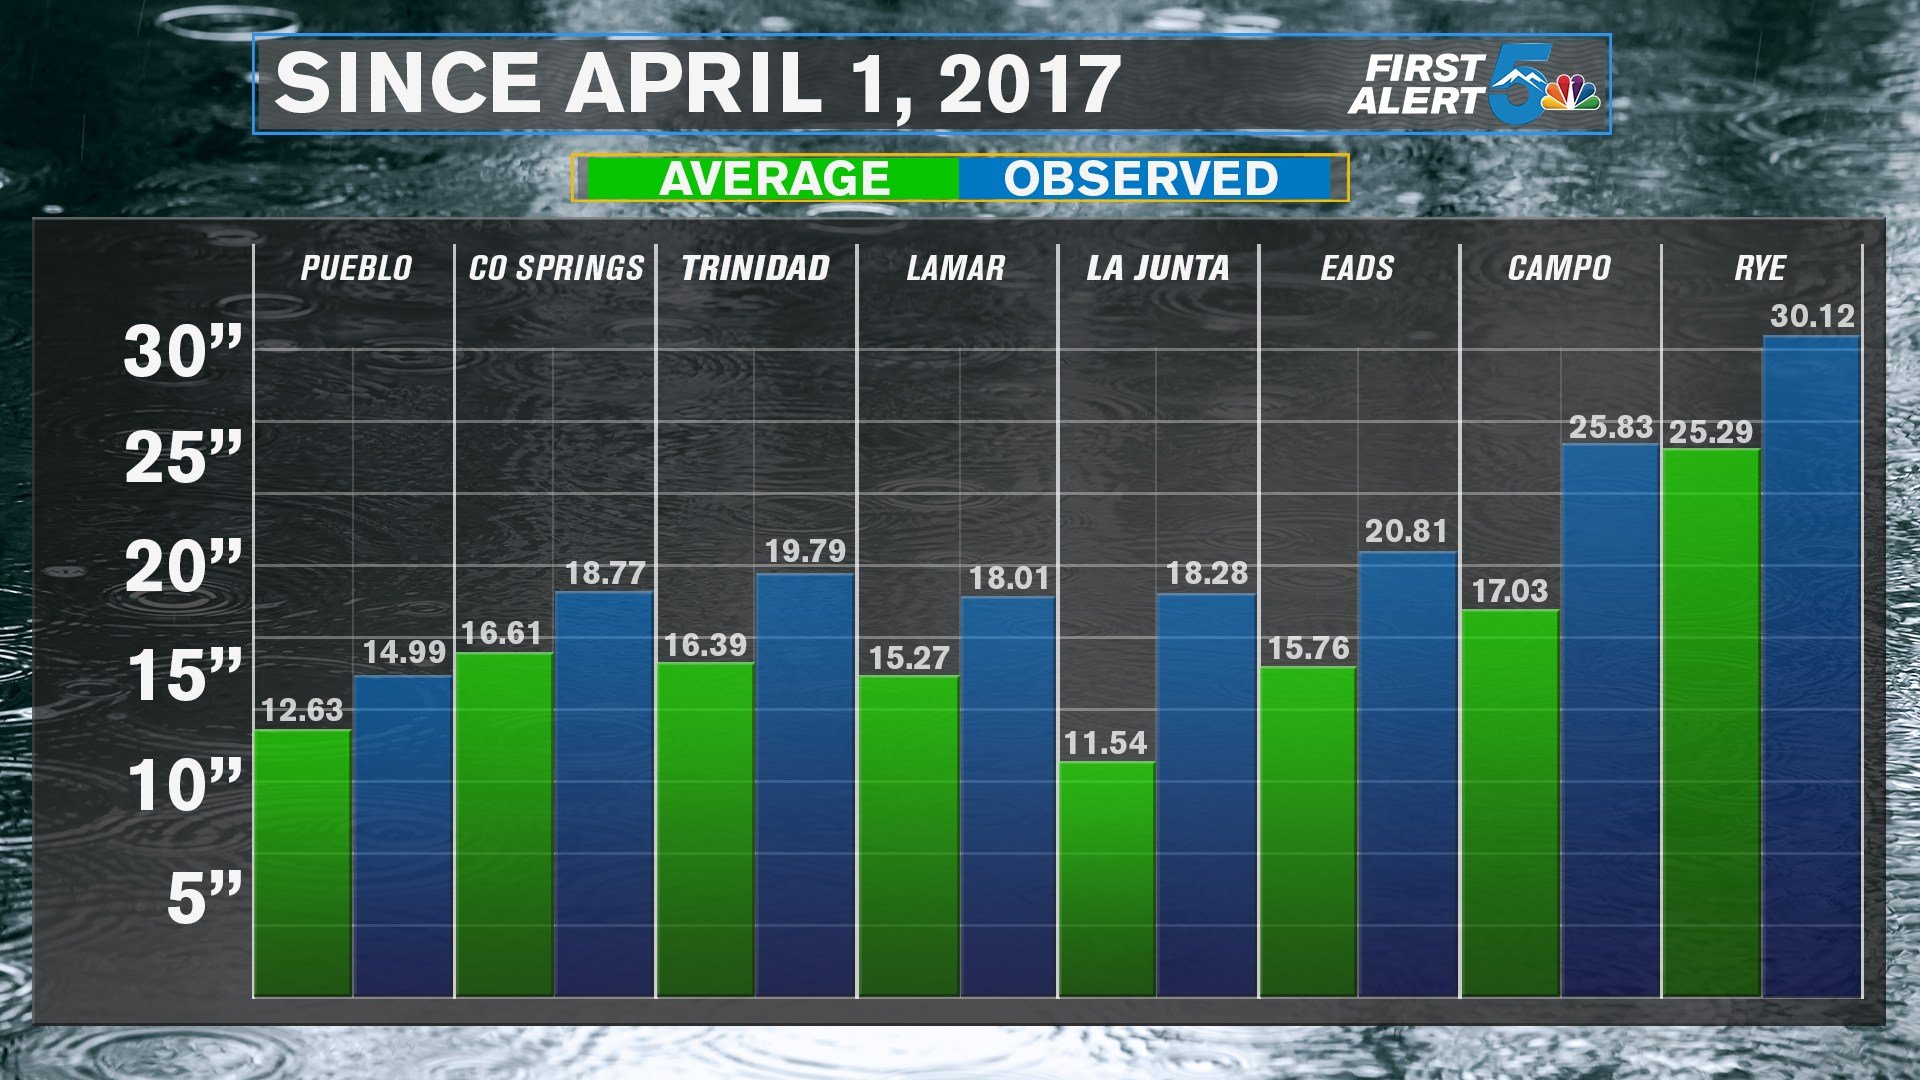
Understand why the reservoirs are in such good shape now? The observed precipitation, remember both rain and snow melted down, is higher than the average value for every town on this graph. Last Spring we had a few big April snows followed by a few decent May rains, but the biggest impact was our longer than normal monsoon season in July through August. July along saw 6 inches of rain in Colorado Springs, that’s 4 inches greater than normal.
So looking at all this data, are we really in a drought? If so, is the drought really all that bad?
Yes and no. Southern Colorado is for sure in a drought, and the blame for that drought can be placed on a La Nina pattern that brought very dry conditions to our Fall and Winter. At the same time, we did so well last Spring and Summer than our water supply is actually in terrific shape, so we really don’t have to worry a water shortage any time soon. Do we still need to worry, for some things absolutely we do. The plains and higher terrain are dry from the lack of moisture and the rest of April through early July will probably continue to be warmer and drier than normal. Our La Nina pattern should return to a neutral pattern by the end of May, and that will hopefully lead to a normal, thirst quenching monsoon season.
